The Fibonacci Retracements

The topic on Fibonacci retracements is quite intriguing. To fully understand and appreciate the concept of Fibonacci retracements, one must understand the Fibonacci series. The origins of the Fibonacci series can be traced back to the ancient Indian mathematic scripts, with some claims dating back to 200 BC. However, in the 12th century, Leonardo Pisano Bogollo an Italian mathematician from Pisa, known to his friends as Fibonacci discovered Fibonacci numbers.
The Fibonacci series is a sequence of numbers starting from zero arranged in such a way that the value of any number in the series is the sum of the previous two numbers.
The Fibonacci sequence is as follows:
0 , 1, 1, 2, 3, 5, 8, 13, 21, 34, 55, 89, 144, 233, 377, 610…
Notice the following:
233 = 144 + 89
144 = 89 + 55
89 = 55 +34
233 = 144 + 89
144 = 89 + 55
89 = 55 +34
Needless to say the series extends to infinity. There are few interesting properties of the Fibonacci series.
Divide any number in the series by the previous number; the ratio is always approximately 1.618.
For example:
610/377 = 1.618
377/233 = 1.618
233/144 = 1.618
610/377 = 1.618
377/233 = 1.618
233/144 = 1.618
The ratio of 1.618 is considered as the Golden Ratio, also referred to as the Phi. Fibonacci numbers have their connection to nature. The ratio can be found in human face, flower petals, animal bodies, fruits, vegetables, rock formation, galaxial formations etc. Of course let us not get into this discussion as we would be digressing from the main topic. For those interested, I would suggest you search on the internet for golden ratio examples and you will be pleasantly surprised. Further into the ratio properties, one can find remarkable consistency when a number is in the Fibonacci series is divided by its immediate succeeding number.
For example:
89/144 = 0.618
144/233 = 0.618
377/610 = 0.618
89/144 = 0.618
144/233 = 0.618
377/610 = 0.618
At this stage, do bear in mind that 0.618, when expressed in percentage is 61.8%.
Similar consistency can be found when any number in the Fibonacci series is divided by a number two places higher.
For example:
13/34 = 0.382
21/55 = 0.382
34/89 = 0.382
13/34 = 0.382
21/55 = 0.382
34/89 = 0.382
0.382 when expressed in percentage terms is 38.2%
Also, there is consistency when a number in the Fibonacci series is divided by a number 3 place higher.
For example:
13/55 = 0.236
21/89 = 0.236
34/144 = 0.236
55/233 = 0.236
13/55 = 0.236
21/89 = 0.236
34/144 = 0.236
55/233 = 0.236
0.236 when expressed in percentage terms is 23.6%.
16.1 – Relevance to stocks markets
It is believed that the Fibonacci ratios i.e 61.8%, 38.2%, and 23.6% finds its application in stock charts. Fibonacci analysis can be applied when there is a noticeable up-move or down-move in prices. Whenever the stock moves either upwards or downwards sharply, it usually tends to retrace back before its next move. For example if the stock has run up from Rs.50 to Rs.100, then it is likely to retrace back to probably Rs.70, before it can move Rs.120.
‘The retracement level forecast’ is a technique using which one can identify upto which level retracement can happen. These retracement levels provide a good opportunity for the traders to enter new positions in the direction of the trend. The Fibonacci ratios i.e 61.8%, 38.2%, and 23.6% helps the trader to identify the possible extent of the retracement. The trader can use these levels to position himself for trade.
Have a look at the chart below:
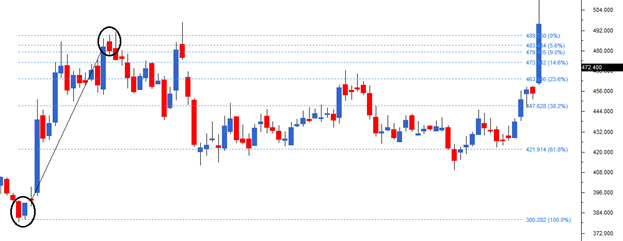
I’ve encircled two points on the chart, at Rs.380 where the stock started its rally and at Rs.489, where the stock prices peaked.
I would now define the move of 109 (380 – 489) as the Fibonacci upmove. As per the Fibonacci retracement theory, after the upmove one can anticipate a correction in the stock to last up to the Fibonacci ratios. For example, the first level up to which the stock can correct could be 23.6%. If this stock continues to correct further, the trader can watch out for the 38.2% and 61.8% levels.
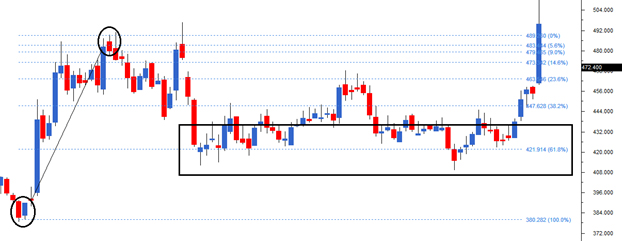
Notice in the example shown below, the stock has retraced up to 61.8%, which coincides with 421.9, before it resumed the rally.
We can arrive at 421 by using simple math as well –
Total Fibonacci up move = 109
61.8% of Fibonacci up move = 61.8% * 109 = 67.36
Retracement @ 61.8% = 489- 67.36 = 421.6
Likewise, we can calculate for 38.2% and the other ratios. However one need not manually do this as the software will do this for us.
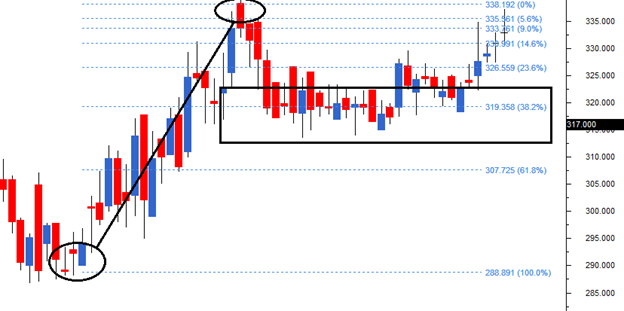
Here is another example where the chart has rallied from Rs.288 to Rs.338. Therefore 50 points move makes up for the Fibonacci upmove. The stock retraced back 38.2% to Rs.319 before resuming its up move.
The Fibonacci retracements can also be applied to stocks that are falling, in order to identify levels upto which the stock can bounce back. In the chart below (DLF Limited), the stock started to decline from Rs.187 to Rs. 120.6 thus making 67 points as the Fibonacci down move.
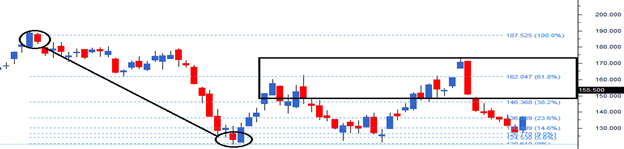
After the down move, the stock attempted to bounce back retracing back to Rs.162, which is the 61.8% Fibonacci retracement level.
16.2 – Fibonacci Retracement construction
As we now know Fibonacci retracements are movements in the chart that go against the trend. To use the Fibonacci retracements we should first identify the 100% Fibonacci move. The 100% move can be an upward rally or a downward rally. To mark the 100% move, we need to pick the most recent peak and trough on the chart. Once this is identified, we connect them using a Fibonacci retracement tool. This is available in most of the technical analysis software packages including Zerodha’s Pi 
Here is a step by step guide:
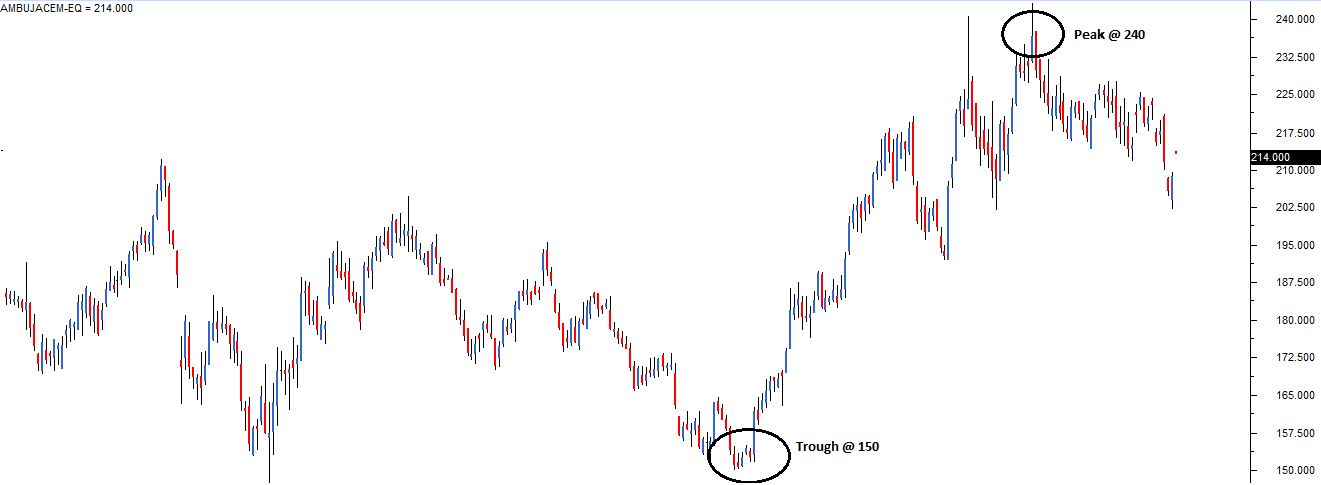
Step 1) Identify the immediate peak and trough. In this case the trough is at 150 and peak is at 240. The 90 point moves make it 100%.
Step 2) Select the Fibonacci retracement tool from the chart tools
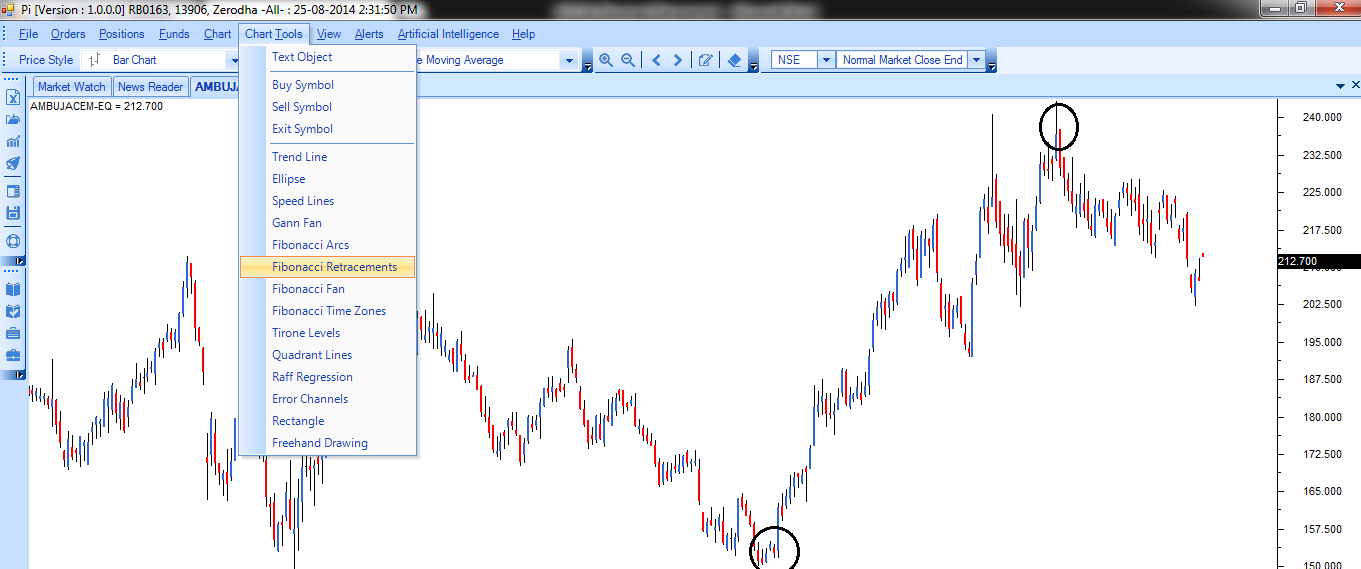
Step 3) Use the Fibonacci retracement tool to connect the trough and the peak.
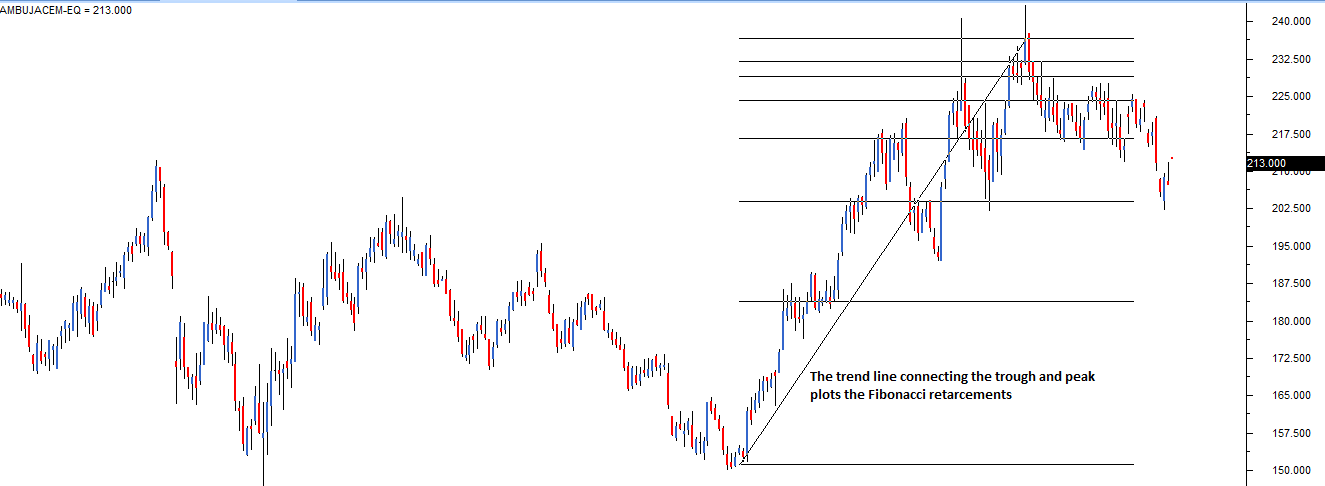
After selecting the Fibonacci retracement tool from the charts tool, the trader has to click on trough first, and without un-clicking he has to drag the line till the peak. While doing this, simultaneously the Fibonacci retracements levels starts getting plotted on the chart. However, the software completes the retracement identification process only after you finish selecting both the trough and the peak. This is how the chart looks after selecting both the points.
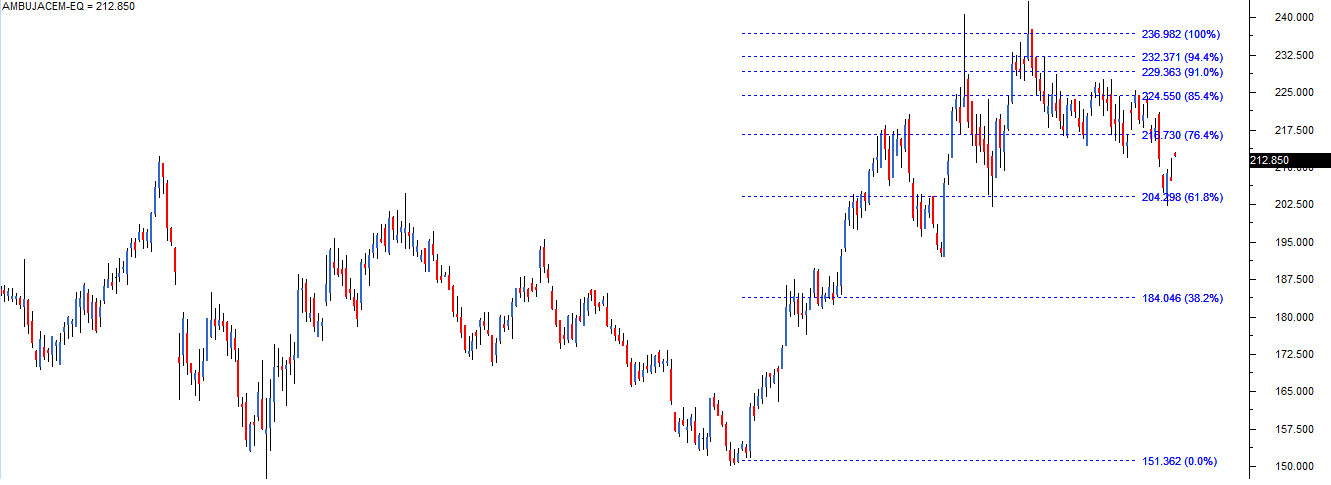
You can now see the fibonacci retracement levels are calculated and loaded on the chart. Use this information to position yourself in the market.
16.3 – How should you use the Fibonacci retracement levels?
Think of a situation where you wanted to buy a particular stock but you have not been able to do so because of a sharp run up in the stock. In such a situation the most prudent action to take would be to wait for a retracement in the stock. Fibonacci retracement levels such as 61.8%, 38.2%, and 23.6% act as a potential level upto which a stock can correct.
By plotting the Fibonacci retracement levels the trader can identify these retracement levels, and therefore position himself for an opportunity to enter the trade. However please note like any indicator, use the Fibonacci retracement as a confirmation tool.
I would buy a stock only after it has passed the other checklist items. In other words my conviction to buy would be higher if the stock has:
- Formed a recognizable candlestick pattern
- The stoploss coincides with the S&R level
- Volumes are above average
Along with the above points, if the stoploss also coincides with the Fibonacci level then I know the trade setup is well aligned to all the variables and hence I would go in for a strong buy. The usage of the word ‘strong’ just indicates the level of conviction in the trade set up. The more confirming factors we use to study the trend and reversal, more robust is the signal. The same logic can also be applied for the short trade.
Key takeaways from this chapter
- The Fibonacci series forms the basis for Fibonacci retracement
- A Fibonacci series has many mathematical properties. These mathematical properties are prevalent in many aspects of nature
- Traders believe the Fibonacci series has its application in stock charts as it identified potential retracement levels
- Fibonacci retracements are levels (61.8%, 38.2%, and 23.6% ) upto which a stock can possibly retrace before it resumes the original directional move
- At the Fibonacci retracement level the trader can look at initiating a new trade. However, before initiating the trade other points in the checklist should also confirm.
Comments
Post a Comment