Average True Range
About:Developed by J. Welles Wilder, the Average True Range (ATR) is an indicator that measures volatility. As with most of his indicators, Wilder designed ATR with commodities and daily prices in mind. Commodities are frequently more volatile than stocks. They were are often subject to gaps and limit moves, which occur when a commodity opens up or down its maximum allowed move for the session. A volatility formula based only on the high-low range would fail to capture volatility from gap or limit moves. Wilder created Average True Range to capture this “missing” volatility. It is important to remember that ATR does not provide an indication of price direction, just volatility. Source: stockcharts.com
What should you know?
- Average True Range (ATR) is an extension of True Range concept
- ATR is not upper or lower bound, hence can take any value
- ATR is stock price specific, hence for Stock 1 ATR can be in the range of 1.2 and Stock 2 ATR could be in the range of 150
- ATR attempts to measure the volatility situation and not really the direction of the prices
- ATR is used to identify stop loss as well
- If the ATR of a stock is 48, then it means that on average the stock is likely to move 48 points either ways up or down. You can add this to the current day’s range to estimate the day’s range. For example the stock price is 1320, then the stock is likely to trade between 1320 – 48 = 1272 and 1320 + 48 = 1368
- If the ATR for the next day decreases to say 40, then it means that the volatility is decreasing, and so is the expected range for the day
- It is best to use ATR to identify the volatility based SL while trading. Assume you have initiated a long trade on the stock at 1325, then your SL should be at least 1272 or below since the ATR is 48
- Likewise if you have initiated a short at 1320, then your stoploss should be at least 1368 or above
- If these SL levels are outside your risk to reward appetite, the its best to avoid such trade.
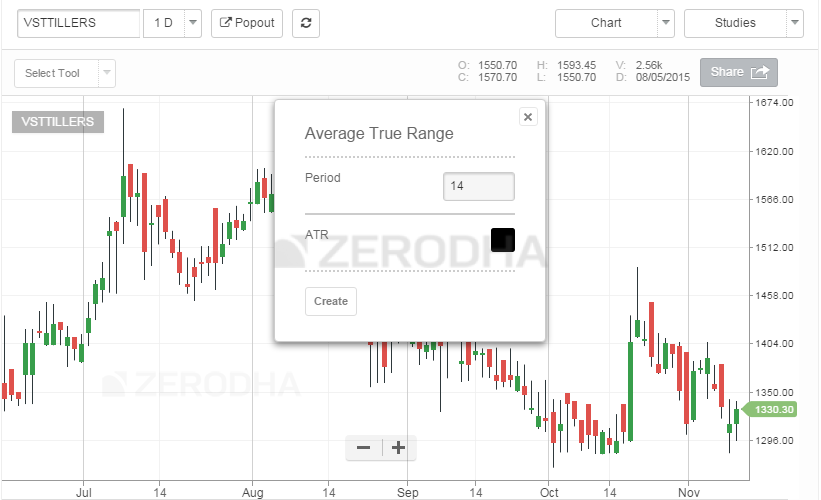
On Kite:As you can see, the default value of ATR is 14, which means to say that the system calculates the ATR for the last 14 days. Of course you can change this to any value to wish. Here is the snapshot –
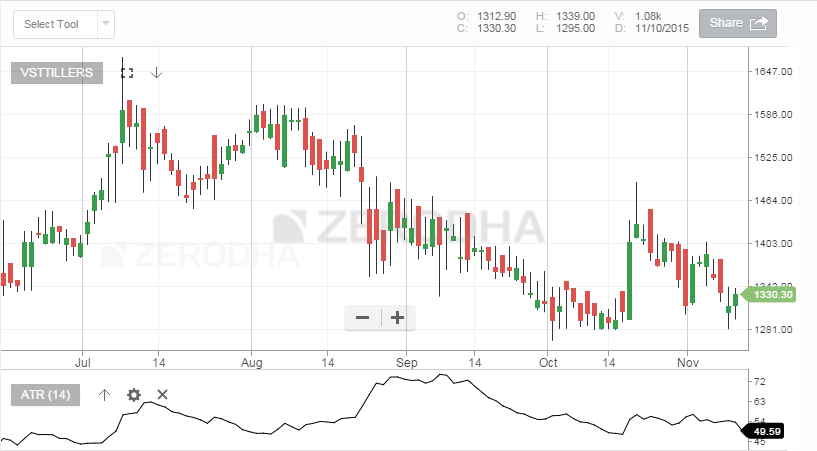
Once you load the chart, ATR is plotted below the price chart as seen below –
So the next time you place a stoploss make sure you check the ATR value to see if stoploss level is relevant. You may also want to read more about volatility and its application (including volatility based SL) –
Click Here
Average True Range Band
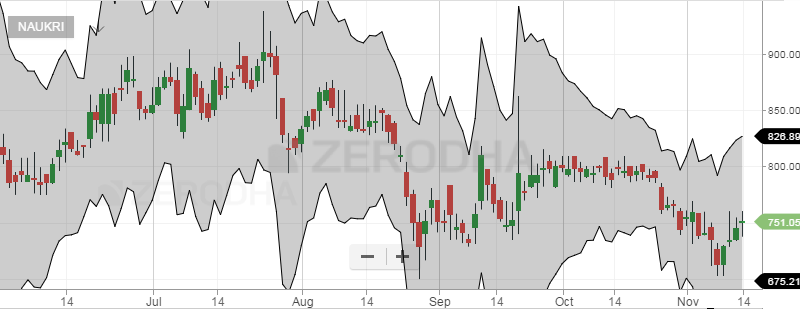
The ATR bands are an extension of the ATR concept. The idea is to plot an envelope around the stock price to evaluate if the stock prices are behaving “normally” or trending in a particular direction. In order to do this, the ATR band calculates the upper and lower band.
What should you know?
- The ATR band calculates and plots the upper and lower envelope around the stock price
- To begin with a moving average of stock price is calculated
- The ATR value is added to the moving average value, and this forms the upper envelop
- The ATR value is subtracted to the moving average value, and this forms the lower envelop
- If the stock price penetrates either the upper or lower envelop, then the expectation is that the stock price will continue to move in the same direction. For example if the stock price has penetrated above the upper envelop, the expectation is that the stock will continue to move higher
- You can even use the ATR bands as an alternate to the Bollinger Band trading system. You can read more about the Bollinger Band (section 15.2)
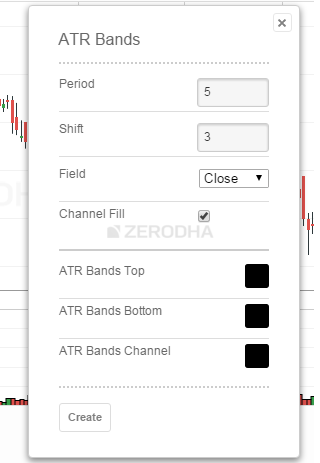
On Kite:When you load the ATR band from studies, you will be prompted for few inputs –
Period refers to the MA time frame; the default value is 5 days. You can change this to whichever time frame that you deem suitable. We would suggest you ignore ‘shift’ parameter. For the ‘field’ option select ‘close’, this means to say that you are plotting the MA values on the closing prices. The rest of the options are mainly aesthetic features, feel free to explore them. Once you click create, you will see the ATR bands plotted on the chart.
 Once you load the chart, ATR is plotted below the price chart as seen below –
 So the next time you place a stoploss make sure you check the ATR value to see if stoploss level is relevant. You may also want to read more about volatility and its application (including volatility based SL) – Click Here
 Period refers to the MA time frame; the default value is 5 days. You can change this to whichever time frame that you deem suitable. We would suggest you ignore ‘shift’ parameter. For the ‘field’ option select ‘close’, this means to say that you are plotting the MA values on the closing prices. The rest of the options are mainly aesthetic features, feel free to explore them. Once you click create, you will see the ATR bands plotted on the chart.
Comments
Post a Comment