Average Directional Index (ADX)
About:The Average Directional Index (ADX), Minus Directional Indicator (-DI) and Plus Directional Indicator (+DI) represent a group of directional movement indicators that form a trading system developed by Welles Wilder. The Average Directional Index (ADX) measures trend strength without regard to trend direction. The other two indicators, Plus Directional Indicator (+DI) and Minus Directional Indicator (-DI), complement ADX by defining trend direction. Used together, chartists can determine both the direction and strength of the trend. Source: stockcharts.com
What should you know?
- ADX system has three components – ADX, +DI, and -DI
- ADX is used to measure the strength/weakness of the trend and not the actual direction
- ADX above 25 indicates that the present trend is strong, ADX below 20 suggest that the trend lacks strength. ADX between 20 and 25 is a grey area
- A buy signal is generated when ADX is 25 and the +DI crosses over –DI
- A sell signal is generated when ADX is 25 and the –DI crosses over +DI
- Once the buy or sell signal is generated, take the trade by defining the stop loss
- The stop loss is usually the low of the signal candle (for buy signals) and the high of the signal candles ( for short signals)
- The trade stays valid till the stoploss is breached (even if the +DI and –DI reverses the crossover)
- The default look back period for ADX is 14 days
On Kite:Load the ADX indicator from studies. Kite gives you an option to change the look back period, by default the look back period is set
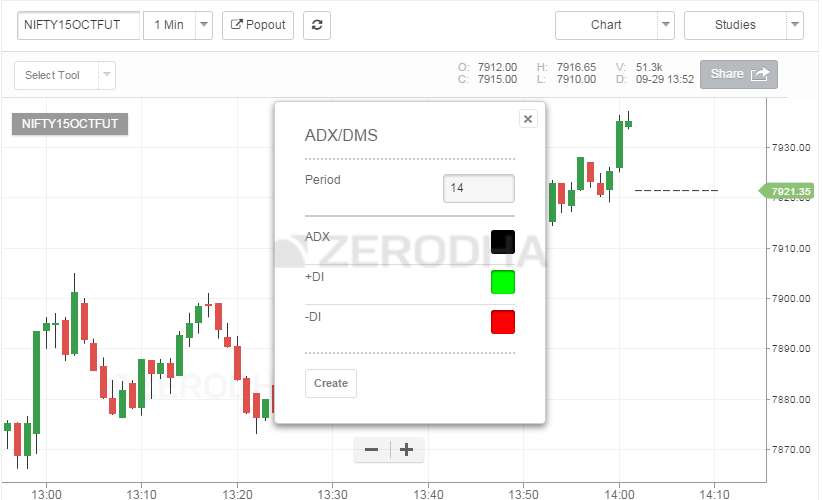
You can customize the color of all the three components of the ADX system. Click on ‘create’ to load the indicator –
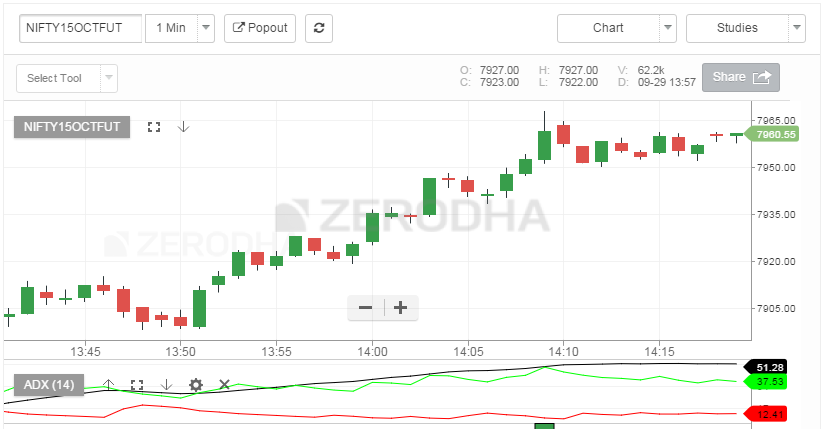
By default the ADX indicator is loaded below the instrument. The black line represents ADX, ensure it is above 25 while looking for the crossovers.
Comments
Post a Comment