Aroon
About:Developed by Tushar Chande in 1995, Aroon is an indicator system that determines whether a stock is trending or not and how strong the trend is. “Aroon” means “Dawn’s Early Light” in Sanskrit. Chande chose this name because the indicators are designed to reveal the beginning of a new trend. The Aroon indicators measure the number of periods since price recorded an x-day high or low. There are two separate indicators: Aroon-Up and Aroon-Down.
A 25-day Aroon-Up measures the number of days since a 25-day high. A 25-day Aroon-Down measures the number of days since a 25-day low. In this sense, the Aroon indicators are quite different from typical momentum oscillators, which focus on price relative to time. Aroon is unique because it focuses on time relative to price. Chartists can use the Aroon indicators to spot emerging trends, identify consolidations, define correction periods and anticipate reversals. Source: stockcharts.com
What should you know?
- The indicator measures the number of days since last high or low is made, hence the indicator is a measure of time relative to the price
- Aroon consists of two component – Aroon up and Aroon Down
- The default value for Aroon is 25 days. Aroon up measures the number of days since the last 25 day high occurred and Aroon down measures the number of days since the last 25 days low has occurred
- Both Aroon up and Aroon down are plotted side by side
- Aroon Up/Down is lower bound to zero and upper bound to 100
- A buy is generated when Aroon up is above 50 and Aroon low is below 30
- A sell is generated when Aroon down is above 50 and Aroon up is below 30
On Kite:Here is the snapshot of the indicator when loaded from studies –
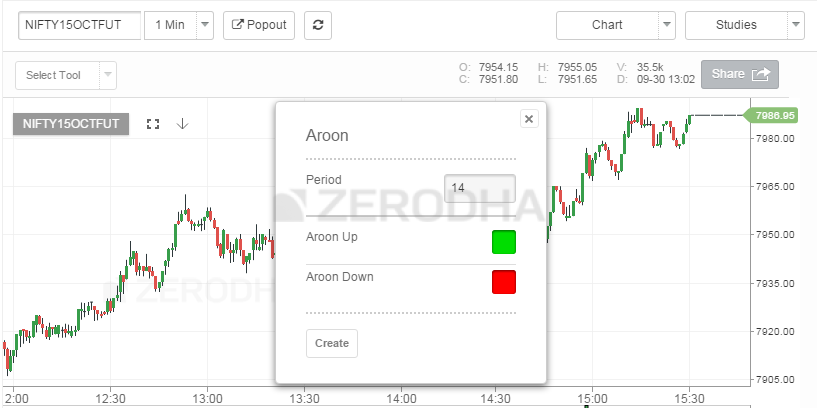
As you can see the default period is 14, feel free to change this to any number you wish. 14 here represent the ‘number of days’. Do remember if the period is 14, the Aroon measures the number of days since the stock made 14 days high/low.
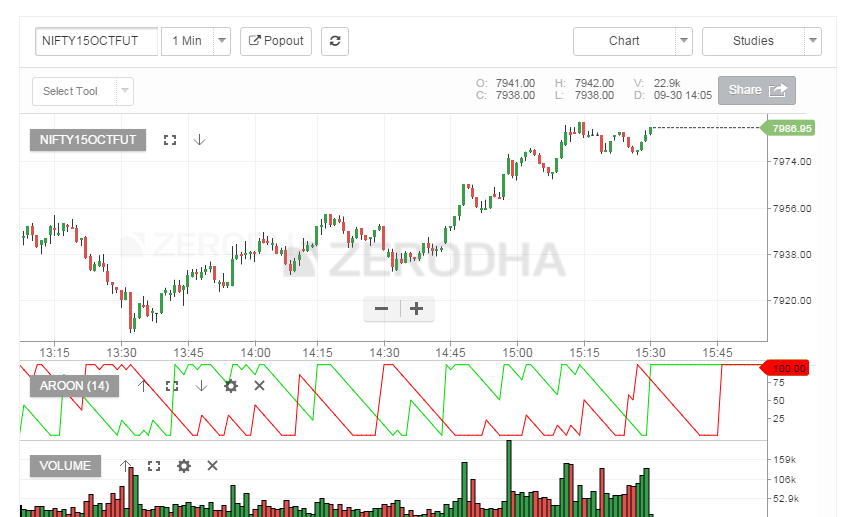
As you can see both Aroon up and Aroon Down are plotted.
Aroon Oscillator
Aroon Oscillator is an extension of the Aroon indicator. The Aroon Oscillator measures the difference between the Aroon up and Aroon down and plots the difference in the form of an oscillator. The oscillator swings between -100 to +100, with the ‘0’ level as the center point.
The snapshot below shows the Aroon Oscillator loaded on to the chart –
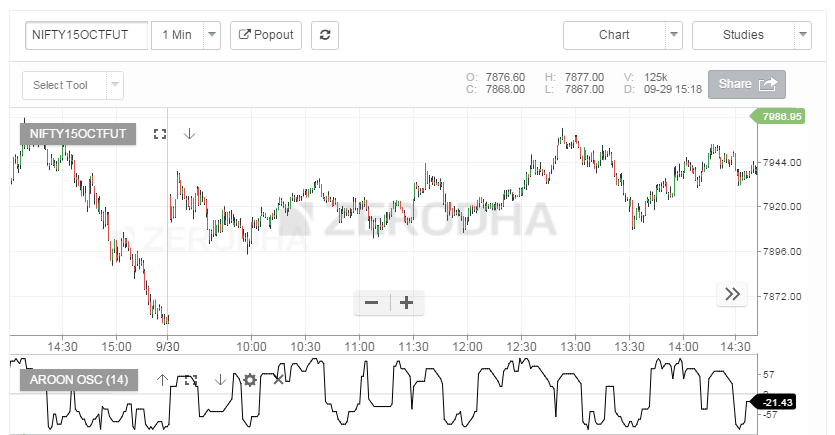
A reading above zero means that Aroon-Up is greater than Aroon-Down, which implies that prices are making new highs more recently than new lows. Conversely, readings below zero indicate that Aroon-Down is greater than Aroon-Up. This implies that prices are recording new lows more recently than new highs.
As you can see, the Aroon Oscillator is either going to be positive or negative the vast majority of the time. This makes interpretation straight-forward. Time and price favor an uptrend when the indicator is positive and a downtrend when the indicator is negative. A positive or negative threshold can be used to define the strength of the trend. For example, a surge above +50 would reflect a strong upside move, while a plunge below -50 would indicate a strong downside move. Source: stockcharts.com
Comments
Post a Comment